Cyber City 2 Could Create 300,000 Jobs—Here's Why Southern Peripheral Road May Become Gurugram's Biggest Housing Story
An institutional analysis of how a second Gurugram business district on Southern Peripheral Road could reshape housing demand — employment build-up, supply gaps, ticket-size distribution, infrastructure timelines and the risks investors are underwriting.
Executive Summary
Gurugram has produced exactly one durable real estate wealth cycle, and it has repeated itself three times. Employment arrives first. Housing follows employment. Infrastructure follows housing. Prices follow infrastructure. Every corridor that skipped step one — that was sold on a road alignment, a master plan or a launch discount — eventually reverted to land value plus inflation.
Southern Peripheral Road is now being positioned as the site of step one for the fourth time. The catalyst is a planned second business district in the Sector 74–75A belt, informally referred to as Cyber City 2, alongside anchor campuses that are already operational: American Express opened a campus of nearly one million square feet in Sector 74A in 2024, and the Air India Training Academy — including a 12,000 sq m Air India–Airbus pilot training centre with ten full flight simulators — is operating in the same catchment.
The number circulating in the market is 300,000 jobs. It is not an official government projection. It is a back-solved figure: if the planned commercial belt eventually delivers office stock of the order of 25 million square feet, and Grade-A occupancy in NCR runs at roughly 80–90 sq ft per seat, the arithmetic lands near 300,000 seats. That arithmetic is sound. The assumption underneath it — that the full belt gets built, leased and occupied — is a fifteen-year proposition, not a three-year one.
Our thesis: SPR is a genuine employment-led corridor, but the market is pricing the 2035 employment outcome into 2026 launch sheets. Average SPR residential rates have moved to roughly ₹16,250 per sq ft, up about 160% in five years and 18.4% year on year, while rents have grown at less than half that pace. The corridor's next five years will be decided not by whether Cyber City 2 happens, but by whether office delivery and metro sanction arrive before the residential completion wave of 2028–2029.
This article introduces the Employment Absorption Ladder — a framework for converting announced jobs into transactable housing demand — and applies it to SPR with explicit assumptions, scenario ranges and a stated bear case.
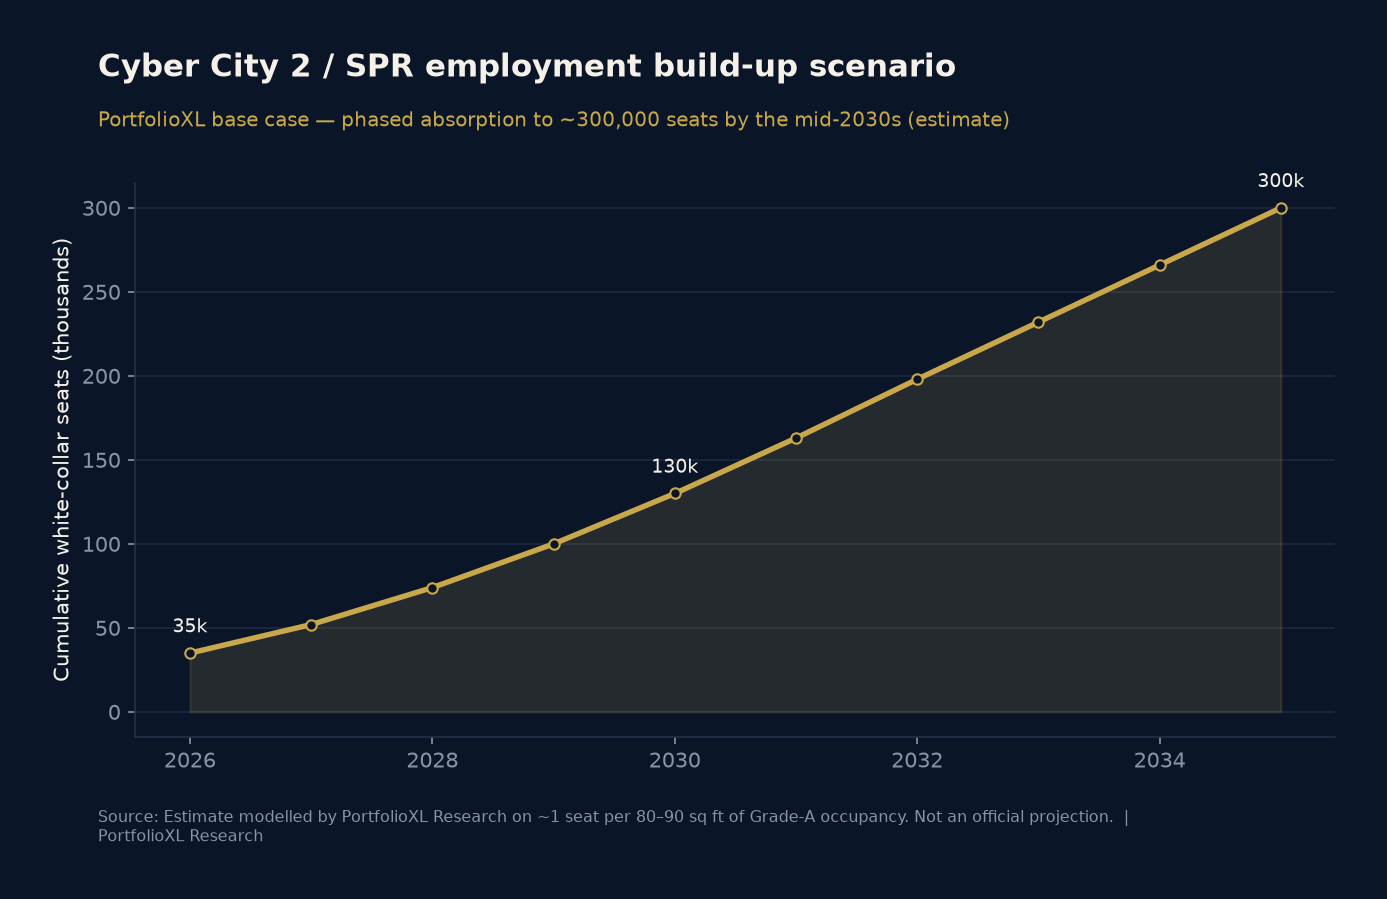
Employment does not arrive as an event. It arrives as a decade-long curve, and the curve is what investors mis-time.
1. What Is Cyber City 2?
Answer box — What is Cyber City 2? Cyber City 2 is the market name for a planned second Grade-A business district in Gurugram, centred on Sectors 74, 74A and 75A along Southern Peripheral Road. It is not a single approved project with one master plan; it is a cluster of commercial land parcels — reported at roughly 385 acres of designated commercial use — being developed in phases by multiple developers, with DLF the most visible participant. It is intended to replicate the integrated office-plus-retail-plus-hospitality format of the original DLF Cyber City on NH-48.
Three distinctions matter for anyone underwriting property on this thesis.
It is a district, not a project. The original Cyber City took roughly two decades to reach its present scale of approximately 12 million sq ft of operational Grade-A stock. A second district of comparable or larger ambition is a similar-duration undertaking. DLF''s rental arm, DLF Cyber City Developers Ltd — a joint venture with Singapore''s GIC — disclosed in FY25 investor material a commitment of about ₹6,000 crore toward roughly 7.5 million sq ft of new office and retail across Gurugram, including 5.5 million sq ft of Grade-A+ office at DLF Downtown and a 2 million sq ft retail asset. That is the visible, funded, under-construction tranche. It is substantial. It is also a fraction of the full 25 million sq ft narrative.
Location is the actual asset. Sectors 74–75A sit at the junction of four movement corridors: SPR itself, NH-48, Golf Course Extension Road and, via feeder links, Dwarka Expressway. For a global occupier, the relevant test is drive-time to IGI Airport and to senior-management housing. This belt passes both — which is precisely why anchor tenants committed here before the district was complete.
Status today is early-phase. Anchor campuses are operational. Commercial construction is live. Retail and hospitality are largely pending. Public transit is at DPR stage, not construction stage. An honest description of Cyber City 2 in 2026 is: credible, funded at the margin, unproven at scale.
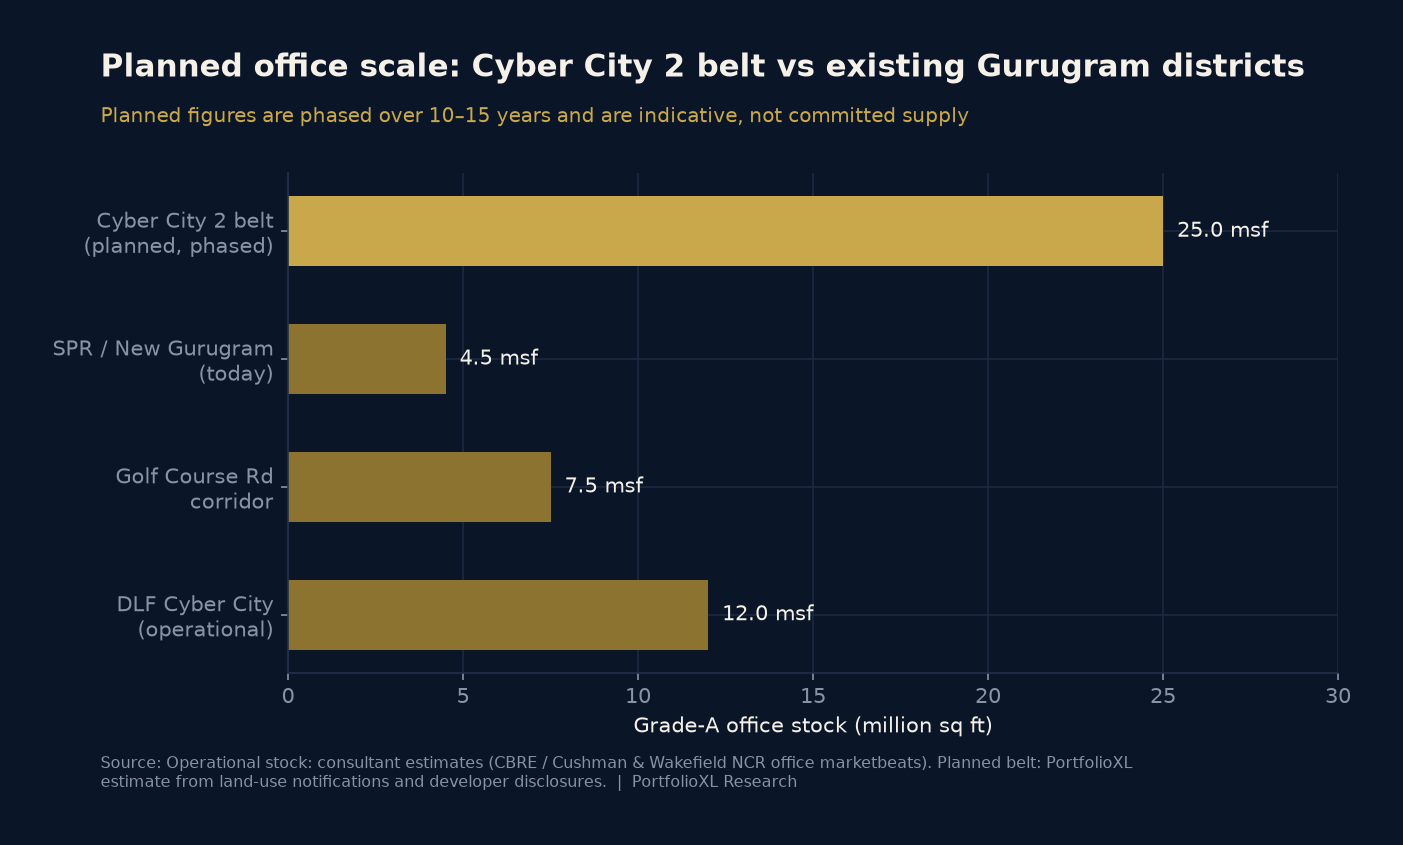
Current versus planned infrastructure
| Element | Status in 2026 | Notes |
|---|---|---|
| SPR carriageway (16 km) | Operational, partially widened | Vatika Chowk–Ghata stretch being taken to eight lanes |
| Vatika Chowk–NH-48 elevated corridor | Under construction | Reported cost ~₹755 crore; target completion 2027 |
| Anchor office campuses | Operational | American Express Sector 74A (~1 msf, LEED Gold, from 2024) |
| Air India Training Academy | Operational | Air India–Airbus JV centre, 12,000 sq m, 10 full flight simulators planned |
| Sector 56–Pachgaon metro | DPR submitted | ~35–36 km, 28 stations, reported ~₹10,428 crore; HSIIDC contribution ~₹1,500 crore |
| Namo Bharat / RRTS interchange | Proposed | Interchanges planned with the metro alignment |
| Organised retail and hospitality | Limited | The principal social-infrastructure gap on the corridor |
2. Lessons From DLF Cyber City: What the First Cycle Actually Taught
The instructive part of the original Cyber City story is not that prices rose. It is the sequence and the lag.
Cyber City began attracting occupiers in the early 2000s. The residential response was not simultaneous. DLF Phase 2 and Phase 3 — walkable to the office core — repriced first, driven by rental demand from mid and senior staff who valued a ten-minute commute over unit size. Sushant Lok and the older Golf Course Road stock repriced next, four to six years later, as senior management formed households and traded up. MG Road absorbed the retail and hospitality spillover. Golf Course Road''s ultra-premium repricing — the phase everyone remembers — came last, roughly a decade after the office district reached scale.
Three mechanics repeated at every stage:
Rental demand preceded ownership demand by three to five years. New arrivals rent while they assess the employer, the city and the school situation. Ownership follows tenure confidence, not job offers.
Social infrastructure was the unlock, not the road. Schools, hospitals and organised retail converted a place people commuted to into a place people lived in. Corridors that got offices but not schools produced rental yield without capital re-rating.
The unit mix that won was not the unit mix that launched. Developers launched large formats for senior management. The volume demand was mid-format housing for the much larger cohort of mid-level employees, plus the service economy that formed around them.
Every one of those three lessons is directly applicable to SPR today, and the third is the one the current launch pipeline is ignoring.
3. Why Global Capability Centres Prefer Gurugram
Answer box — What is a GCC? A Global Capability Centre is an offshore unit owned and operated by a multinational — as opposed to an outsourced vendor — that performs technology, engineering, analytics, finance, risk or product work for the parent group. GCCs sign long leases, invest heavily in fit-out and are structurally stickier tenants than IT services firms.
The scale of this occupier class is now the single most important variable in Indian office demand. JLL''s India GCC Guide 2026 reported record GCC leasing of approximately 31 million sq ft in 2025. CBRE research indicates GCCs leased more than 100 million sq ft between 2022 and 2025, accounting for roughly 39% of total office leasing in 2025, with a record quarterly high of about 9.1 million sq ft in Q1 2026 against overall gross absorption of 20.7 million sq ft.
Delhi NCR''s position within that ecosystem is specific. Bengaluru dominates technology GCCs with a 34–39% national share; Hyderabad leads healthcare and life sciences. NCR''s identified specialisation is corporate services — BFSI, consulting, insurance, travel, professional services, risk and captive finance operations. Gurugram is where that category concentrated, and the reasons are structural rather than promotional:
- A deep leadership talent pool. Corporate-services GCCs need managing directors and functional heads, not only engineers. That cohort is already resident in NCR.
- Airport proximity. For businesses with weekly global travel, drive-time to IGI is a hard operating constraint.
- An established professional-services ring. Accenture, Deloitte, EY, PwC, KPMG, McKinsey and Genpact maintain large NCR operations; captives cluster where their advisors, auditors and hiring pipelines already are.
- Precedent. Google, Microsoft and American Express operating at scale materially de-risks a new occupier''s site decision.
Answer box — Why are GCCs moving to Gurugram? Because corporate-services captives require senior leadership talent, international airport access and an existing professional-services ecosystem — three conditions Gurugram meets better than any alternative in North India. NCR recorded all-time-high office leasing of about 15.8 million sq ft in 2025, up roughly 24% year on year, with Gurugram taking the majority share.
Critically, this occupier class prefers integrated districts over standalone towers: campus-scale floor plates, controlled quality, on-site amenity and shared transport infrastructure. That preference is the entire commercial rationale for building a second Cyber City rather than dispersing supply.
4. American Express and Air India: Anchors Already in Place
The most under-appreciated fact about this corridor is that the transformation is not hypothetical at the anchor level.
American Express inaugurated a campus of nearly one million square feet in Sector 74A in 2024 — described by the company as the largest office it has built from the ground up anywhere globally — with LEED Gold certification and staged colleague relocation.
Air India operates its Training Academy in Gurugram, where an Air India–Airbus 50:50 joint venture pilot training centre was inaugurated with a stated capacity to train more than 5,000 pilots over the next decade, spanning 12,000 sq m and progressively equipping ten full flight simulators.
Why anchors matter more than announcements:
They convert a land bank into a location. A second occupier''s site committee no longer evaluates an idea; it evaluates a neighbour.
They create non-discretionary, salary-backed demand. Anchor employment produces daily footfall regardless of the property cycle — the base load that supports food and beverage, convenience retail, clinics, gyms and co-working.
They generate a training and visitor economy. A pilot training academy is unusual in that it produces continuous medium-stay demand — trainees, instructors, examiners — which supports serviced apartments and hospitality earlier in the cycle than typical office districts do.
They set a rental floor. Corporate leasing for staff housing establishes a rent band that private landlords price against, which in turn establishes a yield-based valuation floor beneath speculative capital values.
What anchors do not do is deliver 300,000 jobs. Two campuses are plausibly 15,000–25,000 seats at maturity. That is roughly 5–8% of the headline number, and it is the honest starting point of the curve.
5. Can SPR Physically Absorb 300,000 Employees?
This is where most corridor analysis stops being analysis. We will make the assumptions explicit.
The Employment Absorption Ladder
A framework for converting announced employment into transactable housing demand. Five rungs, each with a leakage rate:
1. Announced seats → delivered seats. Office construction and leasing risk. Historical delivery against announcement in Indian business districts runs well below 100% over any ten-year window.
2. Delivered seats → catchment residents. Not every employee lives near the office. In Gurugram employment nodes, an 8 km catchment capture of roughly 60–70% is a reasonable planning assumption.
3. Catchment residents → households. Dual-income households and shared accommodation compress the seat-to-household ratio to roughly 1.3 seats per household.
4. Households → tenure split. In new corridors the early split runs approximately 65% rental, 35% ownership, migrating toward ownership over five to seven years.
5. Ownership demand → ticket-size distribution. Compensation bands, not aspiration, determine what actually transacts.
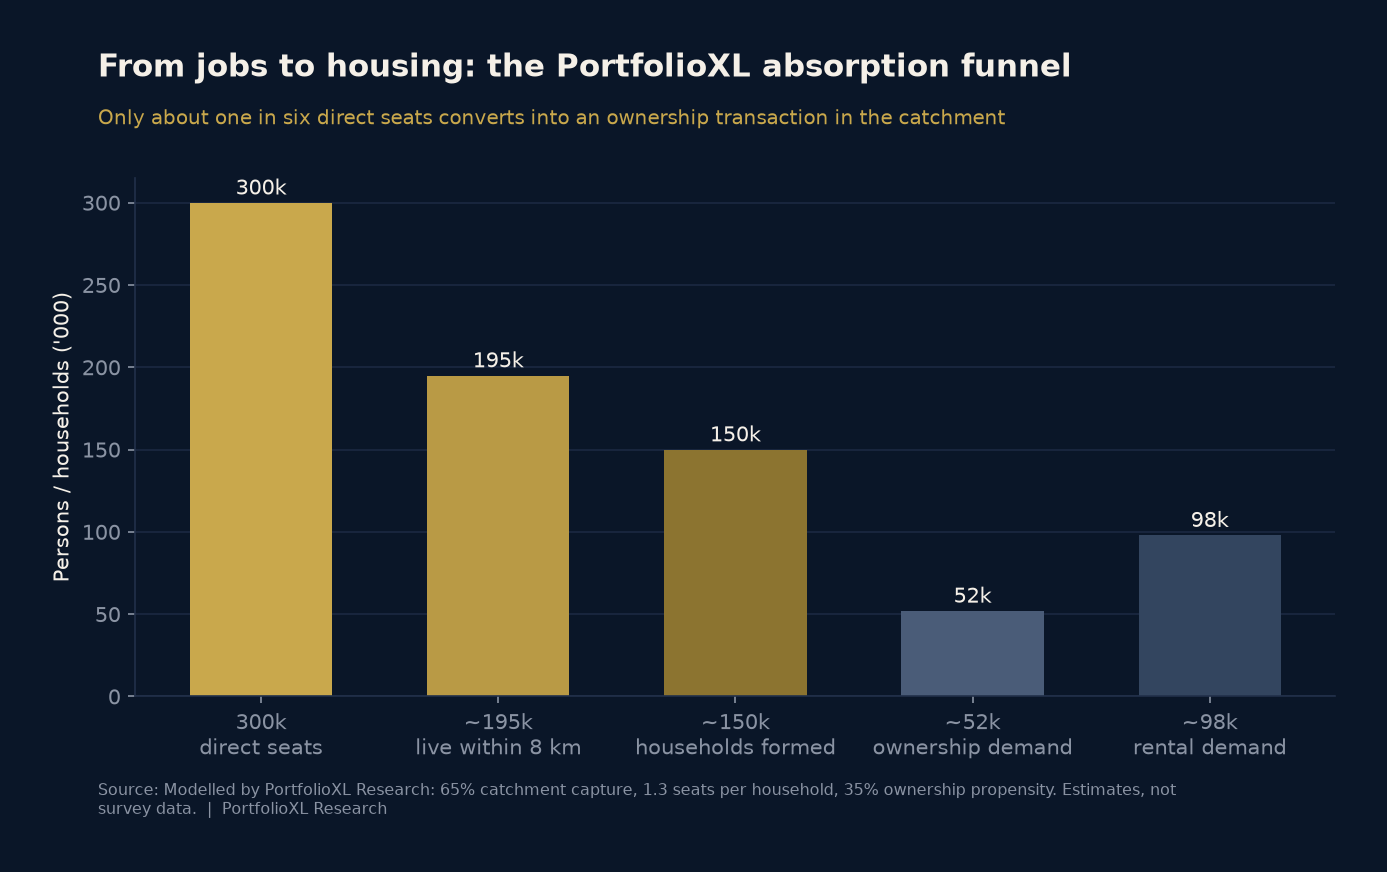
At full 300,000-seat maturity, the ladder implies approximately 150,000 households in the catchment, of which roughly 52,000 represent ownership demand and roughly 98,000 rental demand. Applied to a population multiplier of 3.4 persons per household, the incremental resident population in the belt approaches 500,000 — before counting the service economy discussed in Section 7.
Residential supply against that requirement
| Year | Estimated completions (units) | Employment-led requirement (units) | Cumulative balance |
|---|---|---|---|
| 2027 | ~9,500 | ~10,500 | −1,000 |
| 2028 | ~11,000 | ~13,000 | −3,000 |
| 2029 | ~12,500 | ~16,500 | −7,000 |
| 2030 | ~10,500 | ~19,000 | −15,500 |
| 2031 | ~9,000 | ~21,000 | −27,500 |
Completion figures are consultant-tracker ranges for the SPR and adjoining New Gurugram sectors; requirement figures are PortfolioXL Research estimates derived from the Absorption Ladder. Both are estimates and should be treated as directional.
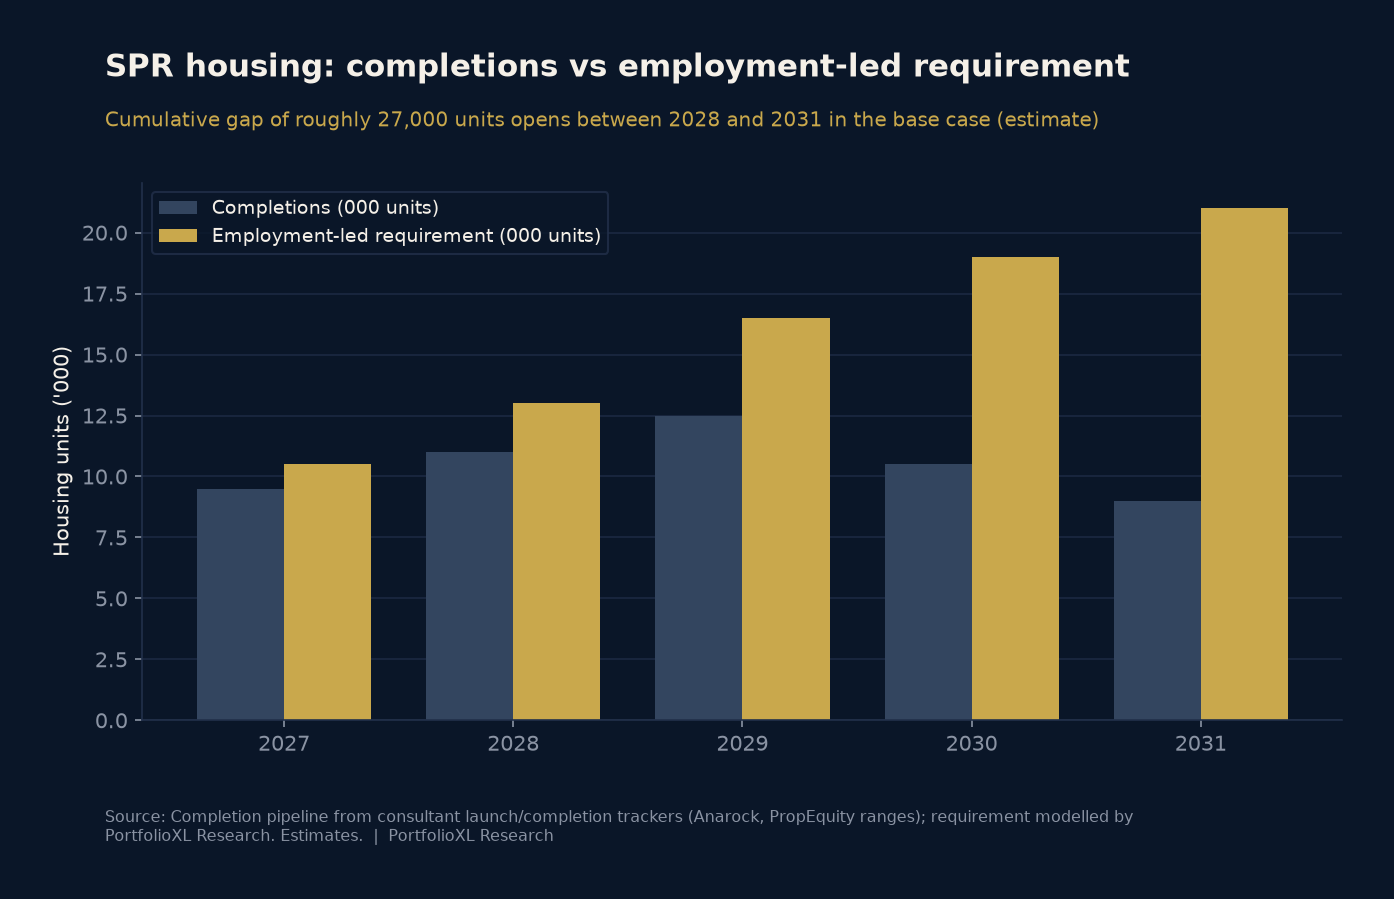
The shape of this chart is the investment case — and also the trap. The deficit opens after 2029. Between now and 2029, the corridor is delivering more units than the employment curve requires. That is a real, near-term absorption risk that the long-term shortage narrative conveniently obscures.
6. Scenario Analysis: What If the Jobs Actually Arrive?
We model three cases to 2032. The variable is delivered seats in the catchment, not announced ones.
| | Bear | Base | Bull |
|---|---|---|---|
| Delivered seats by 2032 | ~95,000 | ~198,000 | ~265,000 |
| Metro operational | No | Partial | Yes |
| Households formed | ~48,000 | ~99,000 | ~133,000 |
| Ownership transactions | ~17,000 | ~35,000 | ~47,000 |
| Rental households | ~31,000 | ~64,000 | ~86,000 |
| Rental growth p.a. | 3–4% | 7–9% | 11–13% |
| Capital growth p.a. | 2–4% | 8–10% | 13–16% |
| Indicative avg. rate 2032 | ₹18,000–20,000/sq ft | ₹26,000–29,000/sq ft | ₹34,000–38,000/sq ft |
PortfolioXL Research scenarios. Estimates, not forecasts. Base case assumes phased office delivery consistent with disclosed developer commitments and metro sanction by 2028.
Demand by ticket size
Compensation determines transaction size. Corporate-services GCC pay bands in NCR spread across a wide range, and the distribution is heavily weighted toward mid-level roles. Mapping those bands to Gurugram lending norms produces the following incremental demand distribution:
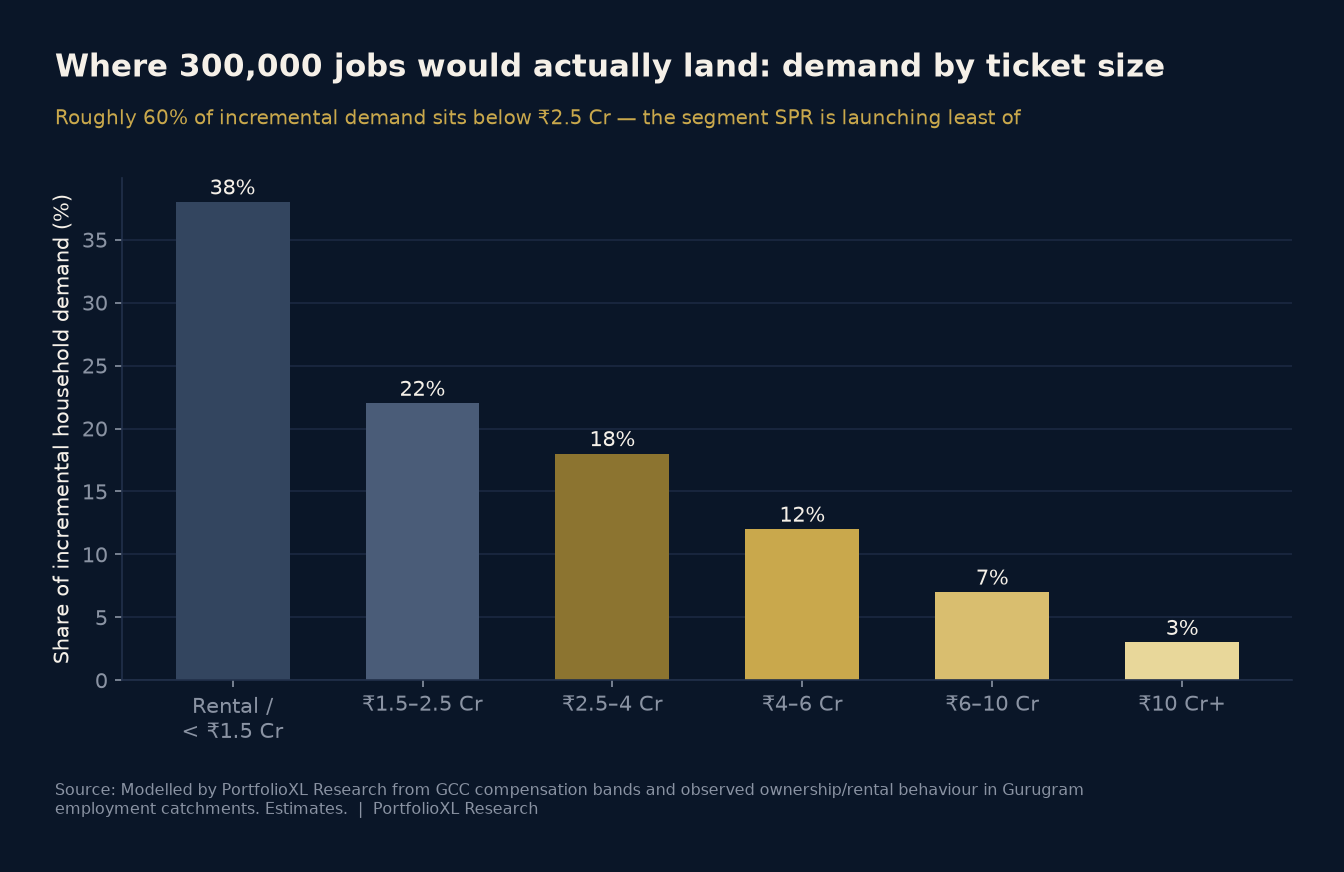
| Ticket band | Share of incremental demand | Typical buyer | Current SPR supply depth |
|---|---|---|---|
| Rental / under ₹1.5 Cr | 38% | Entry and early-career staff | Thin |
| ₹1.5–2.5 Cr | 22% | Mid-level, first purchase | Moderate, shrinking |
| ₹2.5–4 Cr | 18% | Senior individual contributors | Good |
| ₹4–6 Cr | 12% | Directors, VPs, 3BHK + servant | Heavy |
| ₹6–10 Cr | 7% | Senior leadership | Heavy |
| ₹10 Cr+ | 3% | C-suite, family offices | Heavy |
The mismatch is visible without commentary. Roughly 60% of incremental demand sits below ₹2.5 crore. The overwhelming majority of new SPR launches sit above ₹3.5 crore. Developers are building for the top 22% of the demand curve because that is where margin and land economics point — a rational firm-level decision that produces an irrational corridor-level outcome.
For investors this cuts two ways. Scarcity supports mid-segment resale and rental performance. It simultaneously means the ₹4 crore-plus segment — where most new capital is being deployed — is competing for a demand pool one-third the size of the segment below it. Liquidity at exit follows demand depth, not launch price. This is the same reasoning we apply in our Liquidity Ratio framework.
7. The Overlooked Segment: Where the Service Economy Lives
A household buying a ₹4–6 crore apartment in Gurugram typically employs between two and five service workers — domestic help, cook, driver, caretaker, nanny, and building-level security and maintenance staff. This is not incidental. It is a structural feature of the market and it carries a housing requirement of its own.
Applying a conservative ratio of 1.8 service-economy jobs per premium household, the base-case 35,000 ownership transactions by 2032 imply roughly 63,000 service jobs, plus building operations, retail, food service, healthcare support and logistics attached to the office district itself. Total service employment in a mature 300,000-seat catchment plausibly exceeds 200,000 people.
That population needs housing within commuting distance, and at present it is accommodated in three ways: the urban villages embedded within the sector grid (Ghata, Badshahpur, Ullawas, Behrampur and adjoining settlements), older unorganised rental stock, and live-in arrangements within employer households.
Three observations, stated neutrally:
Village rental stock is finite and already tightening. As sector development encircles these settlements, land within them converts to higher-value use. Supply does not expand in proportion to demand.
Rental yields in that segment are materially higher than in premium housing. Small-format unorganised rental in Gurugram commonly transacts at gross yields well above the 2–3% typical of premium apartments. This is where the corridor''s real rental economics currently sit.
Mixed-income ecosystems are a precondition for premium districts, not a byproduct. Business districts that failed to accommodate their service economy within reasonable commuting distance ended up importing it over long distances, which raises wage costs, degrades service reliability and eventually shows up in society maintenance charges and staff attrition.
We flag this as an open policy and planning question rather than an investment recommendation. Organised, licensed affordable rental housing in the periphery of employment districts is a legitimate institutional asset class in several markets. Whether Haryana''s policy framework produces it at SPR is unresolved.
8. Government Infrastructure Is Not Coincidental
Public capital allocation is a revealed preference. Where a state government concentrates spending tells you which corridor it intends to densify.
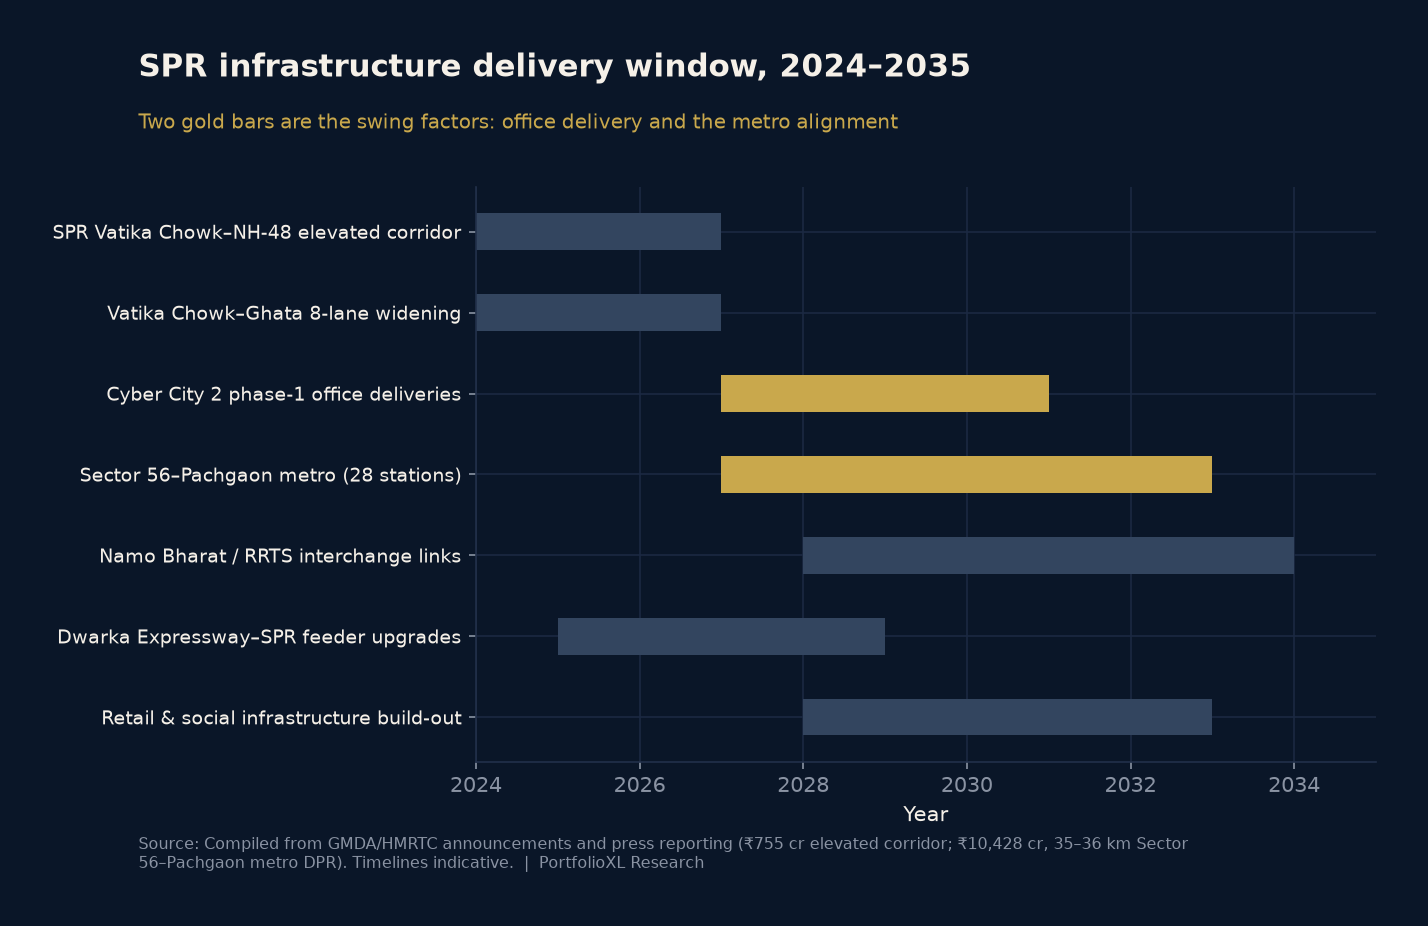
Road capacity. The reported ₹755 crore elevated corridor between Vatika Chowk and NH-48, targeted for 2027, plus eight-laning of the roughly 6 km Vatika Chowk–Ghata stretch, are designed to convert SPR from a signal-constrained arterial into a signal-free corridor. The commute-time effect on the Cyber City 2 belt is direct.
Mass transit. Haryana Mass Rapid Transport Corporation has finalised the DPR for a roughly 35–36 km, 28-station metro corridor from Sector 56 on Golf Course Extension Road to Pachgaon, at a reported cost near ₹10,428 crore, with HSIIDC contributing approximately ₹1,500 crore. The alignment is designed to interchange with the existing Rapid Metro and with proposed Namo Bharat lines, and to serve Global City and IMT Manesar.
This is the corridor''s single most important pending decision. In every Gurugram cycle, metro sanction has repriced land faster than metro commissioning. The DPR stage is not sanction. Investors underwriting metro-driven appreciation are underwriting an approval that has not yet been granted.
Regional connectivity. SPR''s value proposition to occupiers is that it sits inside a multimodal grid — NH-48 to Delhi and Manesar, Dwarka Expressway to Aerocity and IGI, the Delhi–Mumbai Expressway spur to the south-east, and Golf Course Extension Road into the established premium belt. No single link is decisive; the combination is.
| Infrastructure | Type | Status | Expected impact window |
|---|---|---|---|
| Vatika Chowk–NH-48 elevated corridor | Road | Under construction | 2027 |
| Vatika Chowk–Ghata 8-laning | Road | In progress | 2026–2027 |
| Sector 56–Pachgaon metro | Rail | DPR with state government | 2031–2033 |
| Namo Bharat interchanges | Regional rail | Proposed | 2032–2035 |
| Dwarka Expressway feeder links | Road | Partially complete | 2026–2029 |
| Cyber City 2 phase-1 offices | Commercial | Under construction | 2027–2031 |
9. Which Residential Formats Are Positioned to Benefit
We do not recommend individual projects. Format selection, however, is a legitimate analytical exercise, because different formats capture different parts of the demand curve.
Upper mid-income apartments (₹1.8–3 Cr). The deepest demand pool and the thinnest new supply. Strongest rental depth, fastest resale, lowest headline appreciation from a higher base of demand certainty.
Premium apartments (₹3–6 Cr). The corridor''s dominant launch category. Adequate demand, heavy competing supply. Outcomes here will separate sharply by developer execution and delivery date rather than by micro-location.
Luxury and ultra-luxury (₹6 Cr+). Buyer pool is a small share of incremental demand and is largely wealth-driven rather than salary-driven. Appreciation potential is real but liquidity is episodic; exit windows are narrow and concentrated.
Integrated townships. Structurally advantaged where they internalise schools, retail and healthcare, because they solve the social-infrastructure gap that the corridor has not yet solved publicly. Longer capital lock-in.
Builder floors and plots. Highest theoretical appreciation, lowest institutional liquidity, and the greatest dependence on the buyer''s own diligence on title and approvals. Suitable only for investors comfortable with a five-to-eight-year hold and no easy exit.
For corridor-level comparison, our Gurgaon micro-market analysis and corridor comparison tool set out how SPR prices and yields against Golf Course Extension Road, Dwarka Expressway and Sohna Road. Live project-level data sits in our under-construction project research and society intelligence directory.
10. Supply, Demand and the Yield Problem
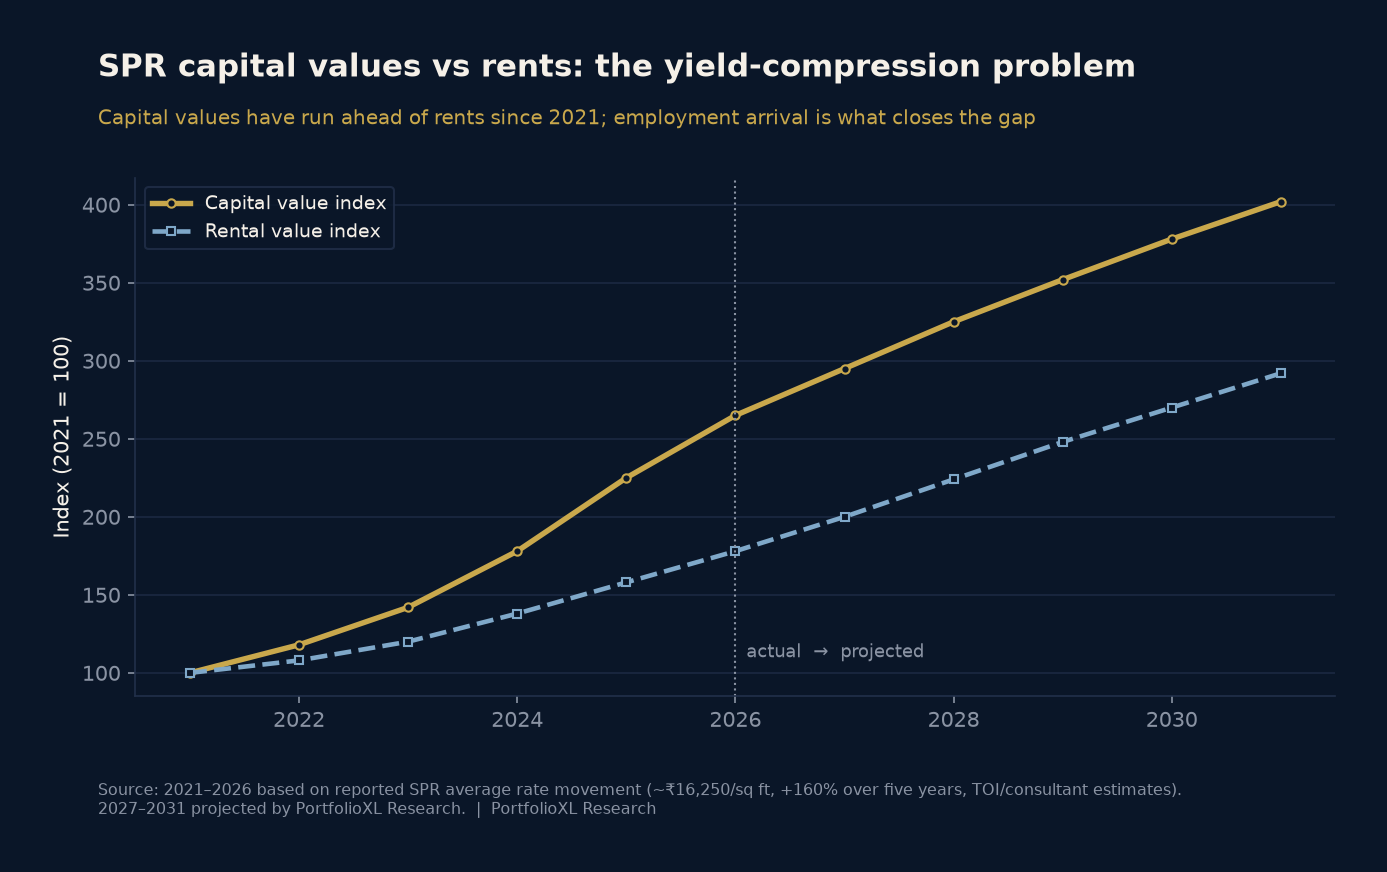
This is the chart that should govern position sizing on SPR.
Capital values on the corridor have risen roughly 160% over five years to about ₹16,250 per sq ft, with 18.4% growth in the most recent year. Rents over the same period have grown at a materially slower pace, because rental demand is a function of resident employment — and resident employment has barely started arriving. The result is yield compression: gross rental yields on new premium SPR stock now commonly sit in the low-2% range.
There are only two ways that gap closes. Rents rise to meet capital values, which requires the employment curve to deliver. Or capital values stall while rents catch up, which is what happens if office delivery slips.
Note also the office side of the ledger. NCR''s office market is genuinely strong — record 2025 leasing near 15.8 million sq ft, vacancy compressing by roughly 285 basis points year on year to around 20.2% on Cushman & Wakefield''s Q3 2025 reading, with Gurugram accounting for roughly 72% of quarterly leasing. But a 20% vacancy rate is not a supply-starved market. New districts compete against existing stock, and occupiers with options negotiate hard. Cyber City 2''s lease-up pace is the variable, and it is not guaranteed.
11. Risks Investors Must Underwrite
A one-sided corridor thesis is a marketing document. These are the conditions under which our base case fails.
Infrastructure slippage. The metro is at DPR stage. Large NCR transit projects have historically slipped multiple years between DPR and commissioning. If sanction slips past 2028, the 2031 price scenarios do not hold.
Near-term oversupply. As Section 5 shows, completions exceed employment-led requirement until roughly 2029. A wave of simultaneous possessions into a market where the jobs have not yet arrived produces distressed investor resale and rental softness — precisely when leveraged buyers need cash flow.
Office lease-up risk. Announced office square footage is not committed square footage. Roughly 20% NCR vacancy means new districts must win tenants from established ones. A slower global GCC cycle — driven by cost pressure, AI-led productivity gains reducing seat counts, or a US or European slowdown — directly reduces the seat count that the entire thesis rests on.
Seat-count deflation. This risk is under-discussed. GCCs are automating high-volume process work. It is entirely possible for the belt to lease 25 million sq ft and employ materially fewer than 300,000 people, because square feet per seat and output per seat are both moving.
Execution and delivery risk. SPR''s launch pipeline includes developers of widely varying balance-sheet strength. Corridor-level appreciation does not rescue a delayed project.
Rate and policy risk. At low-2% gross yields, SPR premium housing is a duration asset. It is highly sensitive to interest rates and to any change in the tax treatment of property gains.
Concentration risk. An investor holding three SPR units is not diversified across three assets. They hold one bet on one employment thesis. We assess this in the portfolio health check.
12. The PortfolioXL Research View
We believe SPR is a legitimate employment-led corridor whose 2026 pricing already reflects a substantial portion of its 2032 outcome — and that the corridor''s risk is concentrated in timing, not in direction.
Four conclusions follow.
First, employment-led appreciation is more durable than infrastructure-led appreciation, and both are more durable than launch-narrative appreciation. SPR is the rare Gurugram corridor with genuine claims to the first category. That is why it deserves analysis rather than dismissal.
Second, entry timing matters more than corridor selection here. The 2028–2029 completion wave arriving ahead of the employment curve is, in our view, the corridor''s most likely source of a buying window. Investors with capital and patience are better served waiting for possession-stage inventory in that window than for pre-launch allotments today.
Third, the demand curve and the supply curve point at different products. Roughly 60% of incremental demand sits below ₹2.5 crore; the majority of new supply sits above ₹3.5 crore. Investors optimising for exit liquidity rather than headline appreciation should weight toward the segment with demand depth.
Fourth, the correct due-diligence question is not "will Cyber City 2 happen?" It is "what is my exit if it happens five years later than the brochure implies?" An asset that survives that answer is investable. One that does not is a leveraged bet on a construction schedule.
We would evaluate any SPR allocation on four data points before price: delivered office square footage in the catchment, metro sanction status, completion volumes in the buyer''s target possession year, and the gross rental yield achievable at entry. If those four are unfavourable, no launch discount compensates.
Further reading: our market intelligence research, investment advisory approach, and complete research archive.
This article is independent research published by PortfolioXL. It is not a recommendation to buy or sell any property, and PortfolioXL has no commercial relationship with any developer named. Figures attributed to CBRE, JLL, Cushman & Wakefield, Anarock, DLF disclosures, GMDA, HMRTC and press reporting are as published by those sources. All modelled figures — the employment curve, absorption ladder, supply-demand balance, ticket-size distribution and scenario tables — are PortfolioXL Research estimates and are clearly labelled as such. Estimates are not forecasts. Investors should verify all data independently before deploying capital.