Why Deferred Payment Plans (25:75, 30:70, 40:60) Beat CLP on ROI — When There's No Loan or Subvention Involved
For a self-funded HNI or NRI investor with no loan and no subvention, Deferred Payment Plans (25:75, 30:70, 40:60) typically deliver a materially higher XIRR than CLP on the same Gurgaon asset — not by changing appreciation, but by minimising capital lock-in during real estate's slowest years. Illustrative XIRR, timing logic, subvention risks and the post-OC trap explained.
The question this note answers is narrow and specific: for a self-funded investor who is not taking a home loan and not using a subvention scheme, does a Deferred Payment Plan (DPP) actually beat a Construction Linked Plan (CLP) on annualised return?
Our answer, based on the mandates we advise on across Gurgaon, is yes — and not because DPP makes the property appreciate more. It doesn't. It wins because it changes the shape of your capital deployment curve during the exact years when Gurgaon real estate does the least work.
The Three Payment Structures — A Quick Levelling
Before comparing returns, the definitions matter, because the market often blurs them.
Construction Linked Plan (CLP)
Payments are released against construction milestones — booking, foundation, each slab, superstructure, finishing, offer of possession. Over a 3–3.5 year project, capital drip-feeds in through roughly 8–10 tranches. This is the default plan for most launches.
Deferred Payment Plan (DPP) — 25:75, 30:70, 40:60
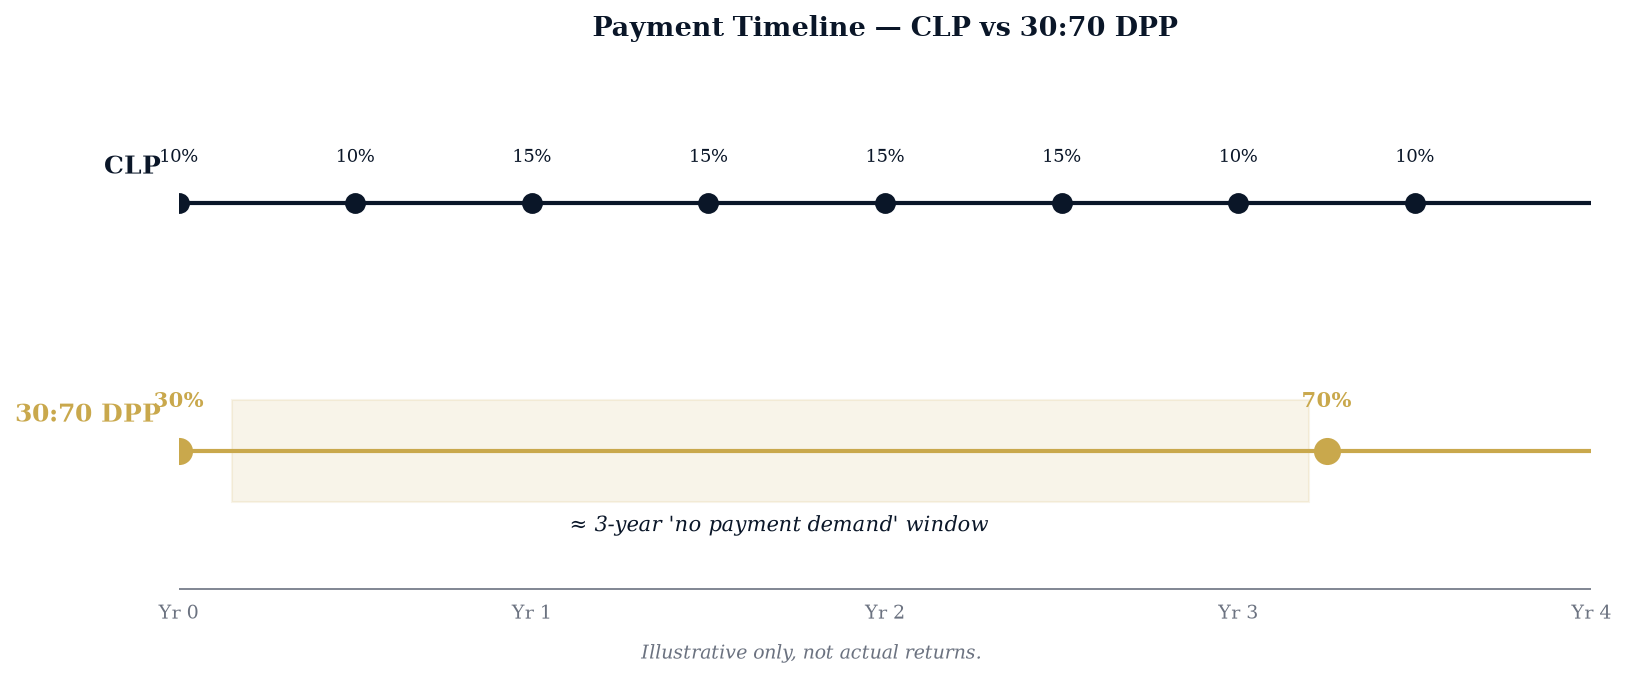
The investor pays a smaller upfront tranche (25–40% of consideration) at booking, and the balance becomes due only at, or close to, possession — typically 2.5–3.5 years later. Between the two, there is no scheduled call for money. Some structures include a small mid-way milestone, but the majority of the balance sits deferred to possession.
Subvention Plan
A loan-linked structure in which the investor takes a home loan upfront, the bank disburses to the builder, and the builder services the pre-EMI interest until possession (or a fixed cut-off). The investor typically pays 10–20% at booking. This is not a cash plan — it introduces bank underwriting, credit exposure, and a hand-off risk we return to later.
The comparison in this note is deliberately restricted to a cash / self-funded investor. Loans and subvention are covered for context and risk framing, not as the base case.
The Power of the "No Demand" Window
Once a 25:75 or 30:70 DPP investor pays the booking tranche, the builder makes no further payment demand for the next ~3 years. Between month 3 and roughly month 36–42, the investor's remaining 60–75% of the consideration is:
- Not locked into the project during its slowest and most execution-sensitive phase
- Not exposed to builder cash-flow risk beyond the booking amount
- Free to earn elsewhere — treasury bills, liquid funds, fixed deposits, or another asset
That is a structural difference in capital exposure, not a marketing claim. Even if the eventual price at possession is identical to a CLP unit, the DPP investor has held far less average capital in the project over the same window.
Why This Beats CLP on ROI — The XIRR Logic
Return on real estate is not just "profit ÷ price." For any serious comparison, the correct measure is XIRR — the annualised, time-weighted rate that discounts every cash outflow and inflow to today.
Two projects can produce the same rupee gain and still deliver very different XIRRs, because XIRR penalises capital that sits deployed for longer.
Consider two investors buying the same ₹1 Cr unit that appreciates to ₹1.4 Cr in four years:
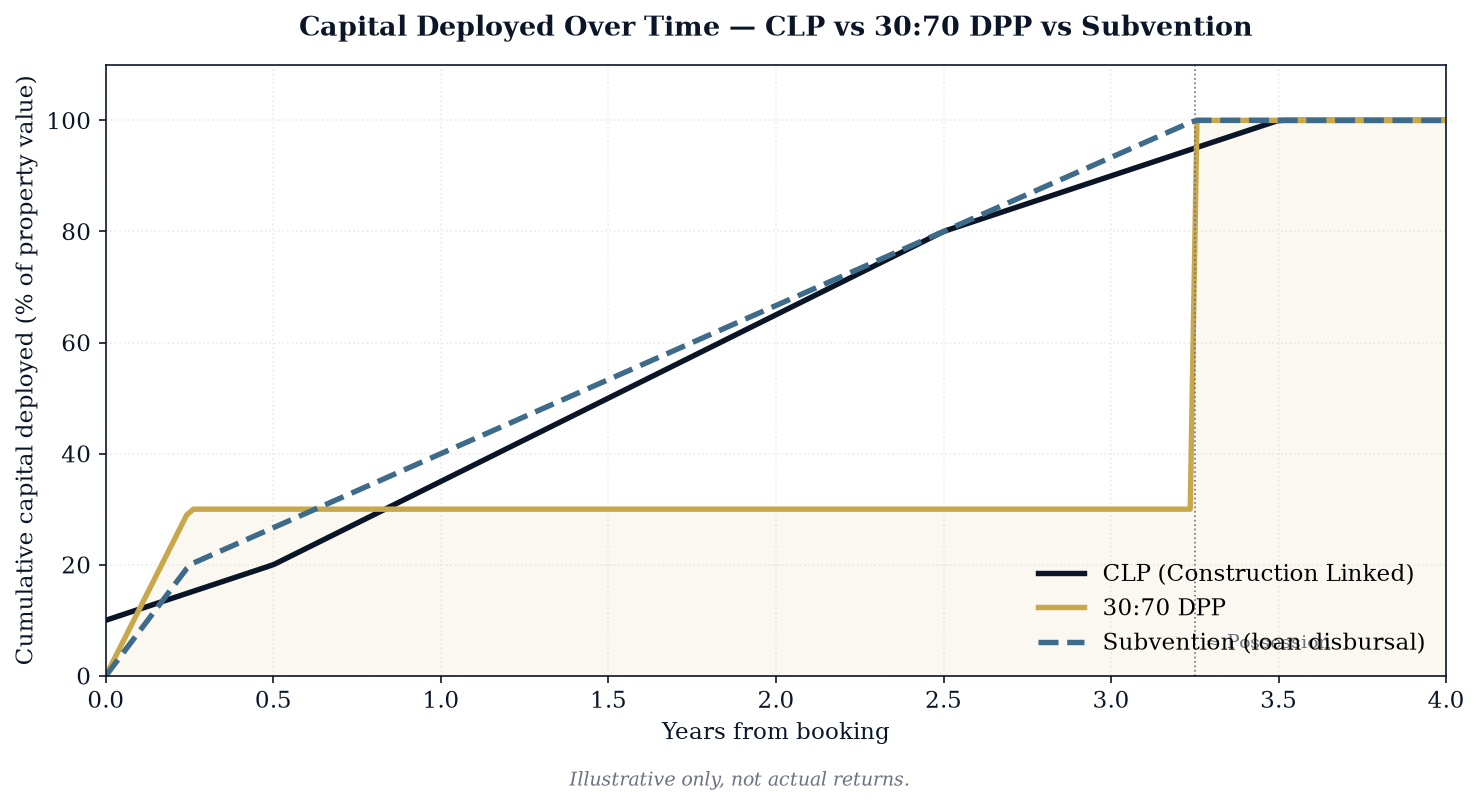
- The CLP investor has, on average, roughly 50–55% of the consideration locked into the project across the construction window. Their gain of ~₹40 lakh is earned on a high average capital base.
- The DPP investor has, on average, roughly 30–35% of the consideration deployed across the same window (because the 70% tranche only lands near the end). The same ~₹40 lakh gain is earned on a smaller average capital base.
Same gain, smaller average capital, similar total duration ⇒ higher annualised return.
> This is a capital efficiency argument, not an appreciation argument. DPP does not make the property worth more. It reduces how much of your money the project consumes to produce the same outcome.
An Illustrative Example — Same Property, Three Plans
To make the mechanics concrete, we run the same asset through three structures. These numbers are illustrative, not a forecast.
- Asset: ₹1 Cr under-construction unit
- Possession: ~3.25 years from booking
- Exit price: ₹1.4 Cr at ~4 years from booking
- Financing: cash for CLP and DPP; standard subvention loan (with typical 6–8% builder-pricing markup) for the subvention case
Cash-flow schedules
| Milestone (yr from booking) | CLP | 30:70 DPP | Subvention |
|---|---|---|---|
| 0 (booking) | –10% | –30% | –20% (investor) + loan sanction |
| 0.5 – 3.0 | –10% to –15% per slab (approx. 8 tranches) | No demand | Bank disbursals to builder; builder services pre-EMI |
| 3.25 (possession) | –10% | –70% | Loan converts to full EMI; investor settles or begins EMI (~₹92% cash-equivalent at possession, including markup) |
| 4.0 (exit) | +140% | +140% | +140% (gross sale) |
Illustrative XIRR
| Plan | Effective avg. capital locked | Illustrative XIRR |
|---|---|---|
| CLP | ~50–55% of price across ~3.5 years | ~15.5% |
| 30:70 DPP | ~30–35% of price across ~3.5 years | ~19.0% |
| Subvention | Low upfront, but lump settlement at possession + markup baked into price | ~16.5% (before builder-default / credit risk) |
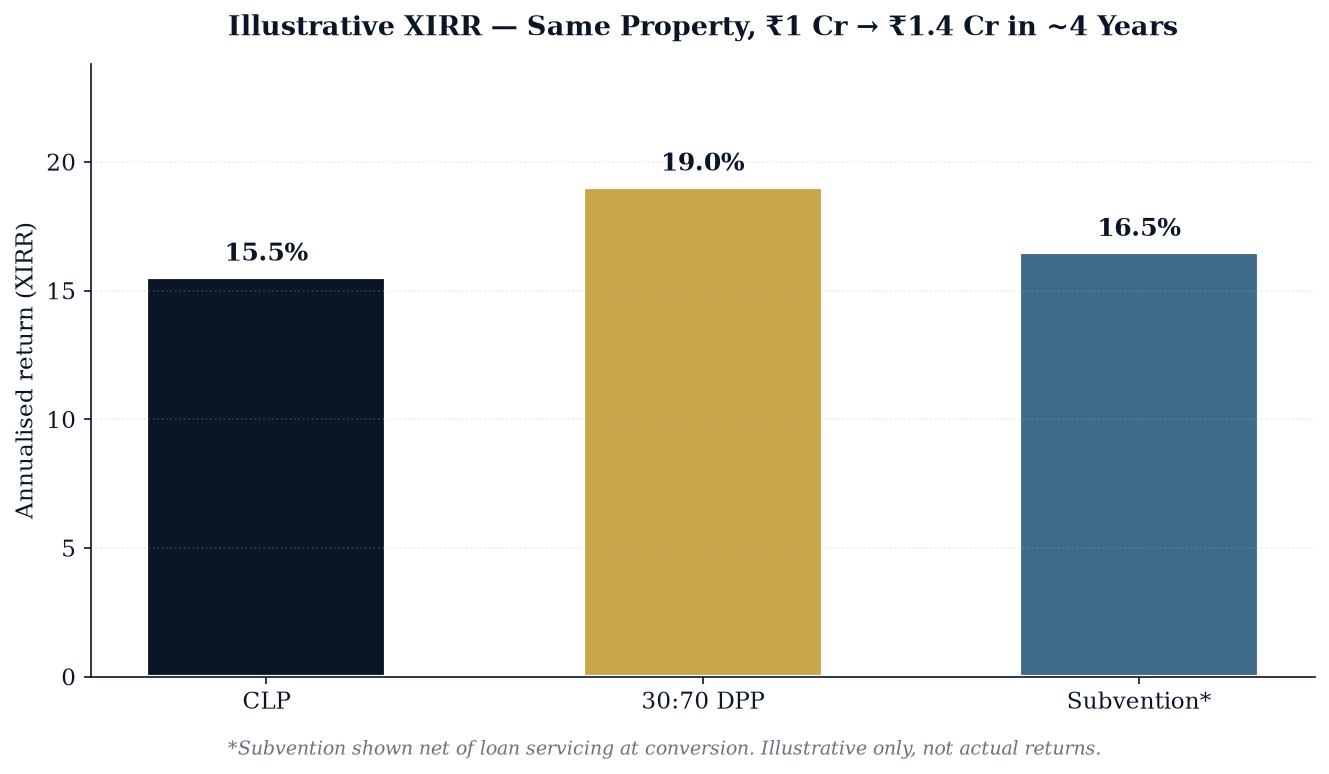
The ~350 basis-point spread between DPP and CLP is not a small number. Compounded across a portfolio, it is often the difference between a good Gurgaon holding and an average one — for the same underlying asset.
Illustrative only, not actual returns. Actual outcomes depend on developer pricing, market cycle, holding period, taxes and transaction costs.
Real Estate Needs 3–4 Years to Mature
There is a second, more important reason DPP wins for a cash investor: the "no demand" window overlaps almost exactly with the period when Gurgaon real estate does the least work.
Across the corridors we track — Dwarka Expressway, SPR, Golf Course Extension Road, New Gurgaon — the pattern is consistent:
- Years 0–2: approvals, foundation, superstructure. Prices move in a narrow band. Most "appreciation" is developer-driven price rises on new inventory, not resale liquidity.
- Years 2–3: external finishes, project identity emerging. Some price movement, but resale is thin.
- Year 3+ (post-OC): the real re-rating window opens.
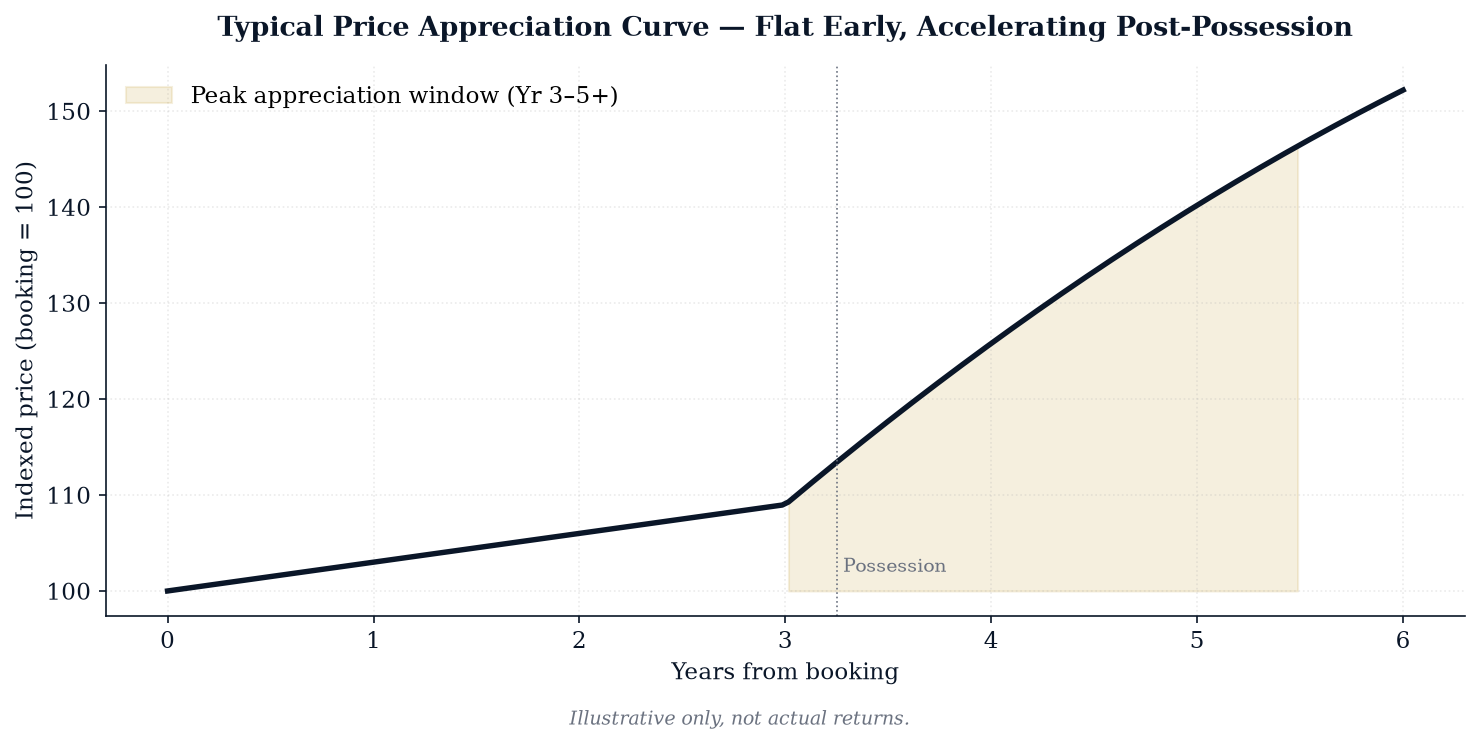
A CLP investor is feeding capital into the project through exactly this flat window. A DPP investor is not. The plan is engineered — whether by design or by accident — to keep your money out of the market's slowest years.
The Real ROI Window: 2 to 5 Years Post-Possession
Peak appreciation on a Gurgaon residential asset typically happens after possession, when:
- The project is occupied and livable
- Amenities are functional, not promised
- Rental evidence exists and yields are demonstrated
- Resale comparables begin to print at real prices, not launch prices
- The micro-market's infrastructure catalysts (metro, expressway, social infrastructure) show up
This is the window in which the DPP investor's larger tranche is deployed — right when the asset is doing its heaviest lifting. Their money is working during the highest-value years, not the flat early years.
For patient, self-funded capital, that timing alignment is the point.
The Hidden Risks of Subvention
Subvention is often marketed as the "smart" plan — small upfront, builder pays the interest, sit back until possession. In practice, we treat it as a plan with asymmetric downside the investor rarely prices in at signing.
- Builder-default risk. The loan is in the investor's name. If the builder delays or defaults on servicing the pre-EMI, the bank looks to the borrower, not the builder. Recovering from the builder is a separate, slower fight.
- Credit-score impact. Any missed or delayed pre-EMI hits the investor's CIBIL, not the builder's. NRIs and HNIs who rely on clean credit for future financing pay a real cost for someone else's cash-flow problem.
- Post-subvention shock. If the project delays beyond the subvention cut-off — a common Gurgaon reality — pre-EMI ends, full EMI begins, and the investor is servicing a construction-stage asset with no rental income and no possession.
- Pricing markup. Subvention units are typically priced 6–8% above CLP equivalents, because the builder is embedding the cost of servicing pre-EMI into the sticker. The "benefit" is often already in the price.
- Loan sanction dependency. The plan is conditional on bank underwriting, disbursal timelines and eligibility — additional moving parts that CLP and DPP do not carry.
Subvention can work with a top-tier developer, disciplined delivery record and a builder balance sheet that can absorb its own commitments. It is not, by structure, a lower-risk plan. It is a plan that transfers execution risk from the builder to the investor's balance sheet and credit file.
Why CLP Investors Get Stuck: The Post-OC Trap
There is a specific failure mode we see repeatedly in portfolio health checks for CLP buyers — especially loan-linked CLP.
The mistake is planning to possession, not through it.
At Offer of Possession (OC), several things happen in quick succession:
- Pre-EMI converts to full EMI — principal + interest. Monthly outflow jumps materially.
- Registration and stamp duty fall due — 6–7% of consideration in Haryana.
- Society formation, maintenance deposits and IFMS are collected upfront.
- Furnishing and habitation costs kick in if the plan was to move in.
- Resale liquidity is thin in the first 12–18 months post-OC — the market has not yet re-rated the asset.
An investor who planned "we'll exit around possession" often finds that possession-year resale is exactly the wrong exit window. Meanwhile the full EMI has already started. The result: full EMIs on an asset that is not yet appreciating fast, cannot yet be rented at target yields, and cannot be exited cleanly.
CLP does not just need payment discipline during construction. It needs a fully-costed post-OC funding plan — rental in place, buffer available, or refinancing sanctioned.
DPP, by contrast, forces the investor to organise a single lump-sum event at possession, usually funded from clear liquidity or the exit of another asset. It is a cleaner cash-flow architecture for investors, not homebuyers.
When CLP or Subvention Still Makes Sense
We are not arguing DPP is always the right answer. In balanced advisory, three cases genuinely favour CLP or subvention:
- Steady-income salaried buyers who are comfortable with an EMI-linked outflow and would rather stagger cash out over 36 months than assemble a lump sum
- Investors who explicitly want builder accountability at every slab — CLP creates checkpoint pressure that DPP structurally reduces
- Genuine end-users buying to live, where the "no rental yield" concern does not apply and staggered payments match personal cash flow
In every other case — and especially for HNIs, NRIs and self-funded portfolio investors — the question is not "which plan is safest?" It is: "which plan makes my capital work hardest for the same asset outcome?"
The PortfolioXL View
For a self-funded investor with no loan and no subvention advantage, DPP structures like 25:75, 30:70 and 40:60 typically deliver a materially higher XIRR than CLP on the same asset — not because they change the property's growth, but because they:
- Minimise average capital lock-in during real estate's slowest years
- Align the large tranche with the highest-value window (2–5 years post-possession)
- Force cleaner cash-flow planning — one lump sum rather than an open-ended EMI trap
- Avoid the hidden risk transfers embedded in subvention
Patience, payment-timing discipline and fund planning matter more than chasing upfront "benefits" or attempting to time an early exit.
If you are evaluating a specific mandate, a Portfolio Health Check can quantify the XIRR differential on your actual asset and holding period — and stress-test the post-OC funding plan before you commit. For NRI-specific structuring (FEMA, repatriation, TDS timing), see our NRI Advisory framework.
Related reading: Southern Peripheral Road (SPR) Gurgaon 2026 · Golf Course Extension Road 2026: Mid-Cycle Re-Rating · HRERA Gurugram 2026 Pre-Booking Checklist
This is educational content, not investment advice. PortfolioXL is a RERA-registered independent real estate advisory (RC/HARERA/GGM/3424/3019/2025/301). Illustrative XIRRs are model-based and depend on developer pricing, market cycle, holding period, taxes and transaction costs.